


Duke Neurogenetics Study MRI Protocol
Amygdala Paradigm
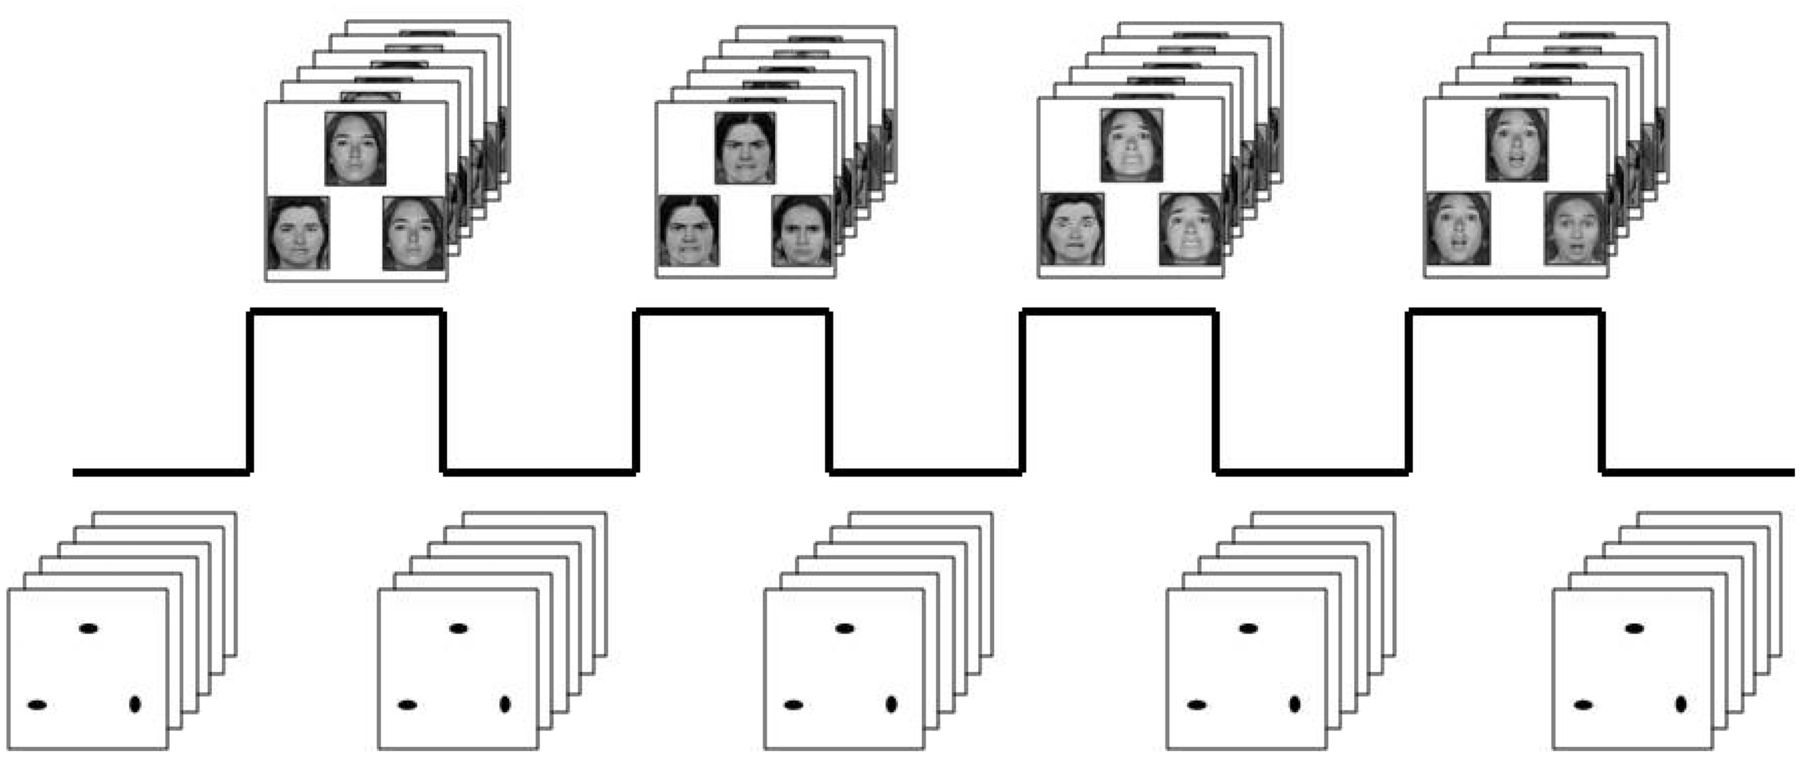
Amygdala Reactivity Paradigm
Our fMRI challenge paradigm has been used extensively to elicit a robust and replicable amygdala response across an array of experimental protocols and sample populations (e.g., Fisher et al., 2006, 2009; Hariri et al., 2002, 2005; Manuck, Brown, Forbes, & Hariri, 2007; Zhou et al., 2008). The experimental fMRI paradigm consists of four blocks of a perceptual face-matching task interleaved with five blocks of a sensorimotor control task. The DNS version of this paradigm consists of one block each of fearful, angry, surprised, and neutral facial expressions presented in a pseudorandom order across participants. During face-matching blocks, participants view a trio of faces and select one of two faces (on the bottom) identical to a target face (on the top, see diagram). Each face processing block consists of six images, balanced for gender, all of which were derived from a standard set of pictures of facial affect (Ekman & Friesen, 1976). During the sensorimotor control blocks, participants view a trio of simple geometric shapes (circles and vertical and horizontal ellipses) and select one of two shapes (bottom) that are identical to a target shape (top). Each sensorimotor control block consists of six different shape trios. All blocks are preceded by a brief instruction ("Match Faces" or "Match Shapes") that lasts 2 s. In the task blocks, each of the six face trios is presented for 4 s with a variable interstimulus interval (ISI) of 2-6 s (mean = 4 s) for a total block length of 48 s. A variable ISI is used to minimize expectancy effects and resulting habituation, and maximize amygdala reactivity throughout the paradigm. In the control blocks, each of the six shape trios is presented for 4 s with a fixed ISI of 2 s for a total block length of 36 s. Total task time is 390 s.
BOLD fMRI Data Acquisition
Each participant was scanned using a research-dedicated GE MR750 3 T scanner equipped with high-power high-duty-cycle 50-mT/m gradients at 200 T/m/s slew rate, and an eight-channel head coil for parallel imaging at high bandwidth up to 1MHz at the Duke-UNC Brain Imaging and Analysis Center. A semi-automated high-order shimming program was used to ensure global field homogeneity. A series of 34 interleaved axial functional slices aligned with the anterior commissure-posterior commissure plane were acquired for full-brain coverage using an inverse-spiral pulse sequence to reduce susceptibility artifacts (TR/TE/flip angle=2000 ms/30 ms/60; FOV=240mm; 3.75×3.75×4mm voxels; interslice skip=0). Four initial radiofrequency excitations were performed (and discarded) to achieve steady-state equilibrium. To allow for spatial registration of each participant's data to a standard coordinate system, high-resolution three-dimensional structural images were acquired in 34 axial slices coplanar with the functional scans (TR/TE/flip angle=7.7 s/3.0 ms/12; voxel size=0.9×0.9×4mm; FOV=240mm, interslice skip=0).
BOLD fMRI Data Pre-Processing
(Note: This description applies the LoNG pre-processing pipeline 2.0, used for all analyses beginning in Spring 2017. For earlier analyses, see pipeline 1.0)Anatomical images for each subject were skull-stripped, intensity-normalized, and nonlinearly warped to a study-specific average template in a standard stereotactic space (Montreal Neurological Institute template) using ANTs (Klein et al., 2009). BOLD time series for each subject were processed in AFNI (Cox, 1996). Images for each subject were despiked, slice-time-corrected, realigned to the first volume in the time series to correct for head motion, coregistered to the anatomical image using FSL's Boundary Based Registration (Greve and Fischl, 2009), spatially normalized into MNI space using the non-linear warp from the anatomical image, resampled to 2mm isotropic voxels, and smoothed to minimize noise and residual difference in gyral anatomy with a Gaussian filter, set at 6-mm full-width at half-maximum. All transformations were concatenated so that a single interpolation was performed. Voxel-wise signal intensities were scaled to yield a time series mean of 100 for each voxel. Volumes exceeding 0.5mm frame-wise displacement or 2.5 standardized DVARS (Nichols, 2017; Power et al., 2014) were censored from the GLM.
fMRI Quality Assurance Criteria
Quality control criteria for inclusion of a participant's imaging data were: >5 volumes for each condition of interest retained after censoring for FD and DVARS and sufficient temporal SNR within the bilateral amygdala, defined as greater than 3 standard deviations below the mean of this value across subjects. The amygdala was defined using a high-resolution template generated from 168 Human Connectome Project datasets (Tyszka et al. 2016). Additionally, data were only included in further analyses if the participant demonstrated sufficient engagement with the task, defined as achieving at least 75% accuracy during the face matching condition.
BOLD fMRI Data Analysis, Full Model
(only applicable to analyses using the original full modeling strategy with entire run in a single model)
Following preprocessing, the AFNI program 3dREMLfit (Cox, 1996) was used to fit a general linear model for first-level fMRI data analyses. Linear contrasts employing canonical hemodynamic response functions were used to estimate effects of condition (Angry block > Control blocks, Fearful block > Control blocks, Surprised block > Control blocks, Neutral block > Control blocks) for each individual. Individual contrast images were then used in second-level random effects models in SPM12 (http://www.fil.ion.ucl.ac.uk/spm) accounting for scan-to-scan and participant-to-participant variability to determine mean condition-specific regional responses using one-sample t-tests. A statistical threshold of p < 0.05, FWE corrected across our amygdala region of interest (defined using a high-resolution templated generated from 168 Human Connectome Project datasets, Tyszka et al. 2016), and ≥10 contiguous voxels was applied to the All faces blocks > Control blocks contrast. This was performed for the entire amygdala (all 10 subnuclei in the Tyszka atlas), the combined Basolateral nuclei, the combined Central and Medial nuclei, and the Central nucleus alone (as this subregion is only 5 voxels in each hemisphere, the 10 contiguous voxel criteria was relaxed), and single subject parameter estimates were extracted from the resulting significant clusters.
BOLD fMRI Data Analysis, Divided Runs
(only applicable to analyses using the newly adapted model where the run is divided into chunks)
Following preprocessing, the AFNI program 3dREMLfit (Cox, 1996) was used to fit general linear models for first-level fMRI data analyses. To obtain parameter estimates for each faces block, we modeled only the respective block (convolved with the canonical hemodynamic response function) along with the adjacent half of the preceding and following control blocks, and a first order polynomial regressor to account for low frequency noise. This allows for the estimation of the individual faces block parameters while minimizing the influence of adjacent faces blocks as well as low frequency noise across the entire run. The resulting parameter images for e.g. the Fear and Neutral blocks were then subtracted to obtain the Fear > Neutral contrast. Amygdala values for each individual and contrast were obtained by averaging over our amygdala regions of interest (defined using a high-resolution templated generated from 168 Human Connectome Project datasets, Tyszka et al. 2016), including the entire amygdala (all 10 subnuclei in the Tyszka atlas), the combined Basolateral nuclei, and the combined Central and Medial nuclei.
References
Fisher PM, Meltzer CC, Ziolko SK, Price JC, Hariri AR. Capacity for 5-HT1A-mediated autoregulation predicts amygdala reactivity. Nat Neurosci 2006;9:1362-1363.
Fisher PM, Meltzer CC, Price JC, et al. Medial prefrontal cortex 5-HT2A density is correlated with amygdala reactivity, response habituation, and functional coupling. Cerebral Cortex 2009;19:2499-507.
Hariri AR, Mattay VS, Tessitore A, et al. Serotonin transporter genetic variation and the response of the human amygdala. Science 2002;297:400-3.
Hariri AR, Drabant EM, Munoz KE, et al. A susceptibility gene for affective disorders and the response of the human amygdala. Archives of General Psychiatry 2005;62:146-52.
Manuck SB, Brown SM, Forbes EE, Hariri AR. Temporal stability of individual differences in amygdala reactivity. American Journal of Psychiatry 2007;164:1613-4.
Zhou Z, Zhu G, Hariri AR, et al. Genetic variation in human NPY expression affects stress response and emotion. Nature 2008;452:997-1001.
Ekman P, Friesen W. Pictures of Facial Affect. Palo Alto, CA: Consulting Psychologists Press; 1976.
Arno Klein, Jesper Andersson, Babak A. Ardekani, John Ashburner, Brian Avants, Ming-Chang Chiang, Gary E. Christensen, D. Louis Collins, James Gee, Pierre Hellier, Joo Hyun Song, Mark Jenkinson, Claude Lepage, Daniel Rueckert, Paul Thompson, Tom Vercauteren, Roger P. Woods, J. John Mann, Ramin V. Parsey, Evaluation of 14 nonlinear deformation algorithms applied to human brain MRI registration, NeuroImage, Volume 46, Issue 3, 1 July 2009, Pages 786-802, ISSN 1053-8119, https://doi.org/10.1016/j.neuroimage.2008.12.037. (http://www.sciencedirect.com/science/article/pii/S1053811908012974)
Cox RW (1996): AFNI: software for analysis and visualization of functional magnetic resonance neuroimages. Comput. Biomed. Res., 29(3):162-173
Greve, D. N., & Fischl, B. (2009). Accurate and robust brain image alignment using boundary-based registration. NeuroImage, 48(1), 63-72. https://doi.org/10.1016/j.neuroimage.2009.06.060
Nichols, T. E. (2017). Notes on Creating a Standardized Version of DVARS, 1-5. Retrieved from http://arxiv.org/abs/1704.01469
Power, J. D., Mitra, A., Laumann, T. O., Snyder, A. Z., Schlaggar, B. L., and Petersen, S. E. (2014). Methods to detect, characterize, and remove motion artifact in resting state fMRI. Neuroimage 84, 320-341. doi: 10.1016/j.neuroimage.2013.08.048
Tyszka, J. M. and Pauli, W. M. (2016), In vivo delineation of subdivisions of the human amygdaloid complex in a high-resolution group template. Hum. Brain Mapp., 37: 3979-3998. doi:10.1002/hbm.23289